GitHub Auditor
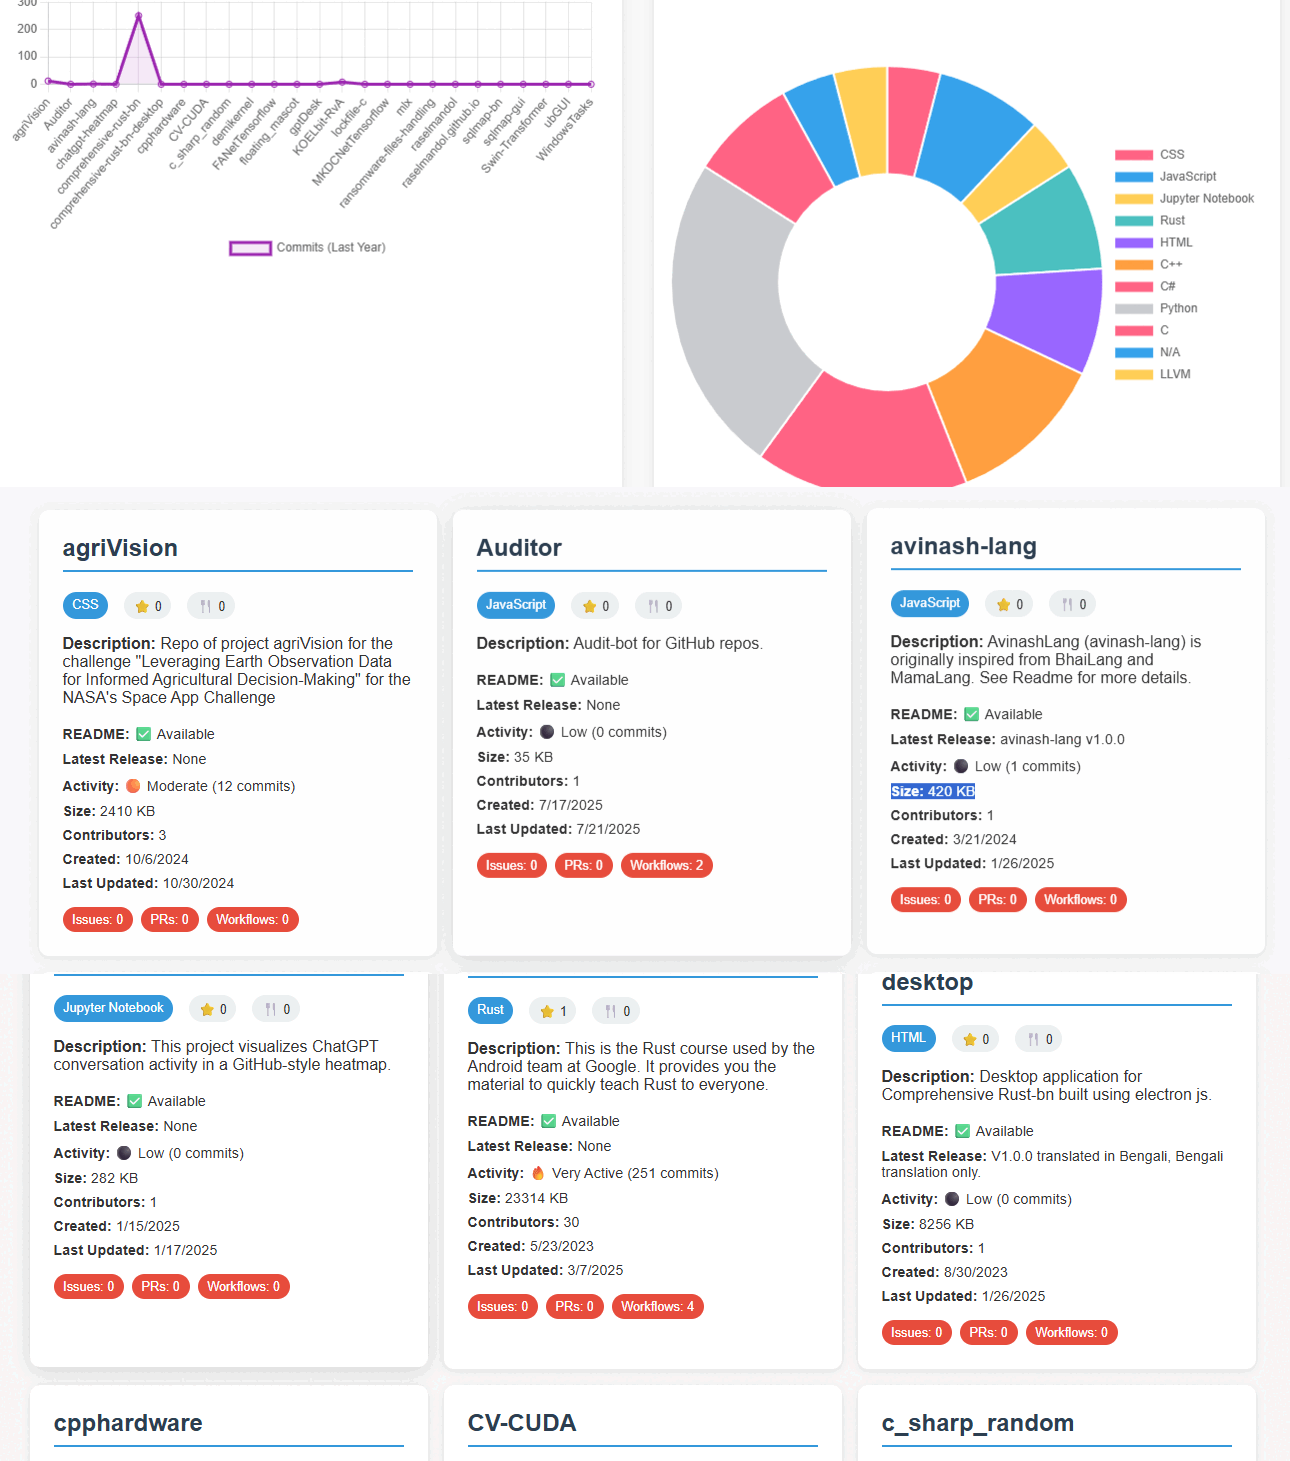
A comprehensive GitHub repository analytics dashboard that automatically monitors and visualizes your GitHub repositories.
GitHub Auditor

GitHub Auditor
A comprehensive GitHub repository analytics dashboard that automatically monitors and visualizes your GitHub repositories with detailed insights, statistics, and interactive charts.


Features
Interactive Dashboard
- Multiple Chart Types: Bar charts, line graphs, and doughnut charts for comprehensive data visualization
- Repository Cards: Detailed information cards for each repository with activity indicators
- Real-time Data: Automatically updated every 6 hours with fresh repository statistics
Analytics & Metrics
- Repository Overview: Stars, forks, size, language, and creation dates
- Activity Tracking: Commit activity over the last year with activity level indicators
- Development Metrics: Open issues, pull requests, and workflow status
- Contributor Analysis: Number of contributors per repository
- README Status: Automatic detection of README file availability
- Release Tracking: Latest release information for each repository
Visual Elements
- Language Distribution: Pie chart showing programming language usage across repositories
- Stars & Forks Comparison: Visual comparison of repository popularity
- Issues & PRs Tracking: Monitor open issues and pull requests
- Activity Levels: Color-coded activity indicators (🔥 Very Active, 🟡 Active, 🟠 Moderate, ⚫ Low)
Quick Start
Prerequisites
- GitHub account with repositories
- GitHub Personal Access Token (Classic)
- GitHub Pages enabled (optional, for hosting the dashboard)
1. Fork/Clone Repository
git clone https://github.com/raselmandol/Auditor.git
cd Auditor
2. Setup GitHub Secrets
Go to your repository Settings → Secrets and variables → Actions and add:
| Secret Name | Description | Required |
|---|---|---|
PAT_TOKEN | GitHub Personal Access Token (Classic) with repo scope | ✅ Yes |
GH_TOKEN | Same as PAT_TOKEN (for API calls) | ✅ Yes |
GIT_USER_NAME | Your GitHub username | ✅ Yes |
GIT_USER_EMAIL | Your GitHub email | ✅ Yes |
3. Create Personal Access Token
- Go to GitHub Settings -> Developer settings -> Personal access tokens -> Tokens (classic)
- Click Generate new token
- Select scopes:
repo,workflow - Copy the token and add it as
PAT_TOKENandGH_TOKENsecrets
4. Configure Username
Edit audit.js and update the username:
const username = "your-github-username"; // Replace with your username
5. Enable GitHub Pages (Optional)
- Go to repository Settings -> Pages
- Select Deploy from a branch
- Choose main branch, / (root) folder
- Your dashboard will be available at:
https://your-username.github.io/Auditor/
How It Works
Automated Workflow
The GitHub Actions workflow (audit.yml) runs:
- Every 6 hours automatically
- On code changes (but not on log.txt updates to avoid loops)
- Manually via GitHub Actions interface
Data Collection Process
- Repository Fetching: Uses GitHub API to get all public repositories
- Detailed Analysis: Collects comprehensive data for each repository:
- Basic info (description, language, stars, forks)
- README status and latest releases
- Issues, PRs, and workflow information
- Commit activity and contributor count
- Log Generation: Creates structured log file (
log.txt) - Auto-commit: Pushes updated data back to repository
Dashboard Rendering
- Data Parsing: JavaScript parses the log file
- Chart Generation: Creates interactive charts using Chart.js
- Card Rendering: Displays repository information in organized cards
- Real-time Updates: Shows last update timestamp
Usage Examples
Viewing Your Dashboard
- GitHub Pages:
https://your-username.github.io/Auditor/ - Local: Open
index.htmlin your browser
Manual Workflow Trigger
- Go to Actions tab in your repository
- Select GitHub Auditor workflow
- Click Run workflow
Customizing Data Collection
Modify audit.js to add more metrics:
// Add custom data collection
const customData = await octokit.someAPI.method({ owner: username, repo: repo.name });
log += ` Custom Metric: ${customData.value}\n`;
Dashboard Components
Charts
- Issues & Pull Requests: Bar chart comparing open issues and PRs
- Stars & Forks: Repository popularity metrics
- Repository Activity: Line chart showing commit activity trends
- Programming Languages: Distribution of languages across repositories
Repository Cards
Each card displays:
- Repository name with language badge
- Stars and forks count
- Description and README status
- Activity level with commit count
- Size, contributors, and dates
- Metrics for issues, PRs, and workflows
Configuration
Workflow Schedule
To change the update frequency, edit audit.yml:
schedule:
  - cron: '0 */6 * * *'  # Every 6 hours
  # - cron: '0 0 * * *'   # Daily at midnight
  # - cron: '0 0 * * 0'   # Weekly on Sunday
Styling Customization
Modify style.css to change:
- Color schemes
- Layout arrangements
- Card designs
- Chart appearances
License
This project is open source and available under the MIT License.
Acknowledgments
- GitHub API: For providing comprehensive repository data
- Chart.js: For beautiful and interactive charts
- GitHub Actions: For automated workflow execution
- GitHub Pages: For free dashboard hosting
- Copilot, Claude Sonnet 4, GPT-4.1: For always helping me debug errors, suggest code and fixes, and build this repo–including this README.
